In last week’s post, I offered my hot take on the first half of Medscape’s recently released annual National Physician Burnout & Suicide Report 2021.
This week, I’ll take a closer look at what this survey (and many others) highlighted as the biggest contributor to physician burnout: bureaucratic tasks, chief among them charting.
Without further ado…

Click here to access ‘Death by 1000 Cuts’: Medscape National Physician Burnout & Suicide Report 2021
Please note that the link above is to a Google search for the article as linking directly to it requires a Medscape login. It is currently the first hit.
"The Willing Horse Is Always Overworked."
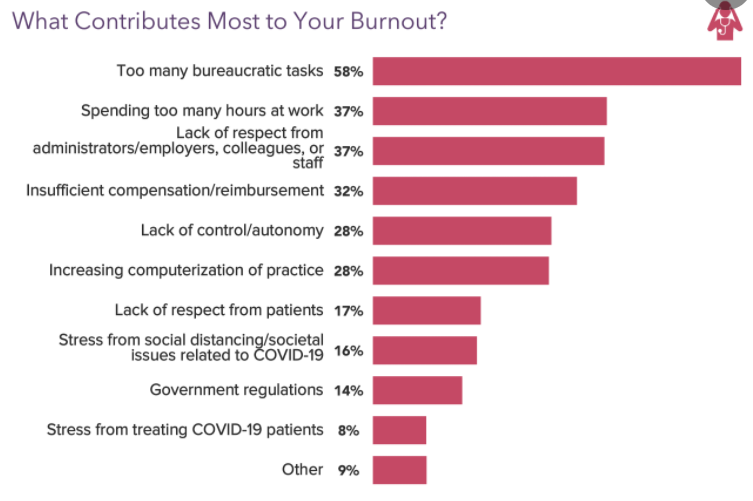
As you may recall from last week’s post, the leading cause of burnout amongst physicians surveyed by Medscape is charting and other administrative tasks. Almost 60% of doctors assigned charting the gold medal in contributing to their burnout.
The runner-up is spending too much time at work.
I would amend this second one to read “spending too much time ON work,” since that would encompass time at work as well time working at home.

Two Become One
These two causes are directly related. The more charting we have to do, the more time it takes and the longer we have to spend at work and/or working at home (pajama charting, anyone?).
We don’t generally get much protected time assigned to chart and complete paperwork, etc. Most of us get some “admin” time, but that is often taken up by other work requirements including meetings, trainings, and the like.
(And the time burden of these meetings and trainings often also contribute to burnout. Additionally, we typically are told in meetings that we have been assigned more bureaucratic tasks to complete in the same amount or less time…oh and with less ancillary staff support).
Furthermore, time we spend seeing patients almost inevitably spills over our “assigned” hours and outpaces our admin time. Thus, our “protected time” is at best usually a wash, and at worst a joke.
Yeah, But This Is Just a Boomer Issue, Right?
Last week’s post commented on the different burnout experiences between men and women physicians.
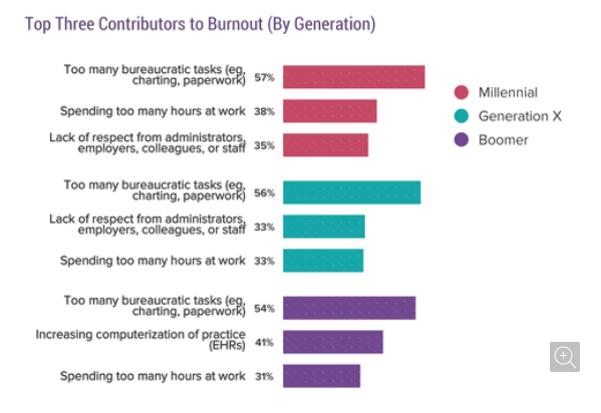
Medscape’s same survey from 2020 examined generational differences in burnout.

Source: Medscape National Physician Burnout & Suicide Report 2020: The Generation Divide
As you can see, no matter the physician age charting and spending too much time at work are in the top three contributors to burnout.
This issue affects all generations of physicians, not just the hunt-and-peck typing Boomers (ageist much?).
Interestingly, despite the fact that older physicians have endured more transitions and seismic shifts in medicine, the most burned out generation is actually the Gen Xers (ages 40-54 years) per the Medscape 2020 Report.
The thought behind this is that middle-aged physicians are mid-career and juggling more roles outside of work including caring for children and aging parents.
Doctor, Is It Serious?
How bad is this charting and time issue?
Well, the short version is: pretty bad.
The longer (but still reasonable length) version is as follows…
The data consistently show the burden of charting on physicians. One study showed that for every hour of direct patient care time, almost two additional hours is spent charting “within the clinic day.”
This works out to physicians spending on average just 27% of their time in clinic seeing patients, with the remaining 73% spent on everything else, mostly charting.
The reason for this is because charting is how we get paid (completing our notes, inputting appropriate diagnostic and billing codes, and finally closing charts) as well as avoid penalties related to “quality metrics” and the like. Charting is also how we communicate and ensure continuity of care. Finally, there’s the cover-your-ass (CYA) medicolegal aspect.
If you hear physicians complaining about their EHR (electronic health records) being worse than the paper charts of yesteryear, it’s because EHRs have had a multiplier effect on all of this all the while being hailed as the holy grail of making our lives better.
The volume of data has exploded. The number of tasks and clicks we have to do have exploded. It only seems to increase year after year. That’s why charting activities occupy almost 3/4ths of our time!
Even more frustrating it that all this work doesn’t necessarily improve the care we can provide to our patients.
Hot Date Night with the EHR
The above quoted one hour of care generating almost two hours of charting does not include personal time spent outside of clinic, which was 1-2 hours each night. Other studies have looked at this “pajama charting” specifically.
For example, this study found that the average time spent at home charting per day (including weekends) is 86 minutes!

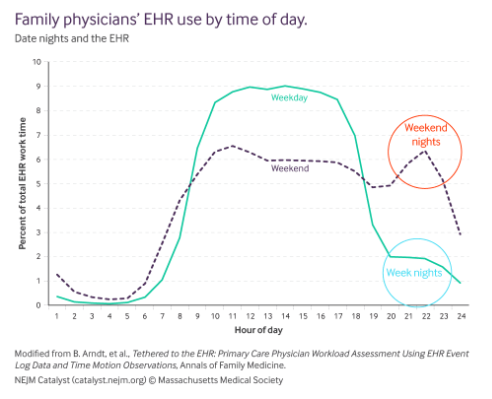
The above infographic is a little bit odd at first glance, but shows the percent of EHR work completed based on hour of the day, split between the green line for weekdays and the dashed purple line for weekends.
This infographic is modified from the last study referenced to highlight how much time physicians spend on weekends charting. And more specifically weekend nights!
Charting and Chill?
On a personal note, I recall that after my wife and I started our primary care jobs several years ago we would spend many a weeknight and weekend charting together on opposite ends of the couch.
“Charting” here is not a euphemism. Charting and chill isn’t a thing. At least not yet.
The amount of work we brought home was not sustainable. And this was before we had children.
We both made changes to help decrease time spent at home charting in our attempts to stave off burnout. Now I rarely bring my work home.
(Well, okay, in the COVID era, I work from home two days of the week—one dedicated to video visits and the other to a medical directorship role I have within my organization—but that doesn’t count as bringing work home since it is working from home.)
Now You've Gone and Gotten Me All Fired Up!
So if charting is the leading cause of physician burnout, what’s being done to address it?
I’m glad you asked. But you’ll have to wait until next week to find out!
I hope this post demonstrated how painful charting can be for physicians. It not only pulls us away from patients, but also from our families. For many, if not most, physicians, it sucks the joy out of medicine. That’s why charting is the leading cause of our burnout.
How does charting impact your career and your life? Let me know in the comments section below.
If you haven’t subscribed to my email list, then do so below so you don’t miss my new posts or my weekly updates (only for subscribers).
I’d also be most appreciative if you shared this post with anyone whom you think would benefit from the content or message of the blog.
